NFL Defensive Matchup Props: Interceptions and Sack Totals
 Available in US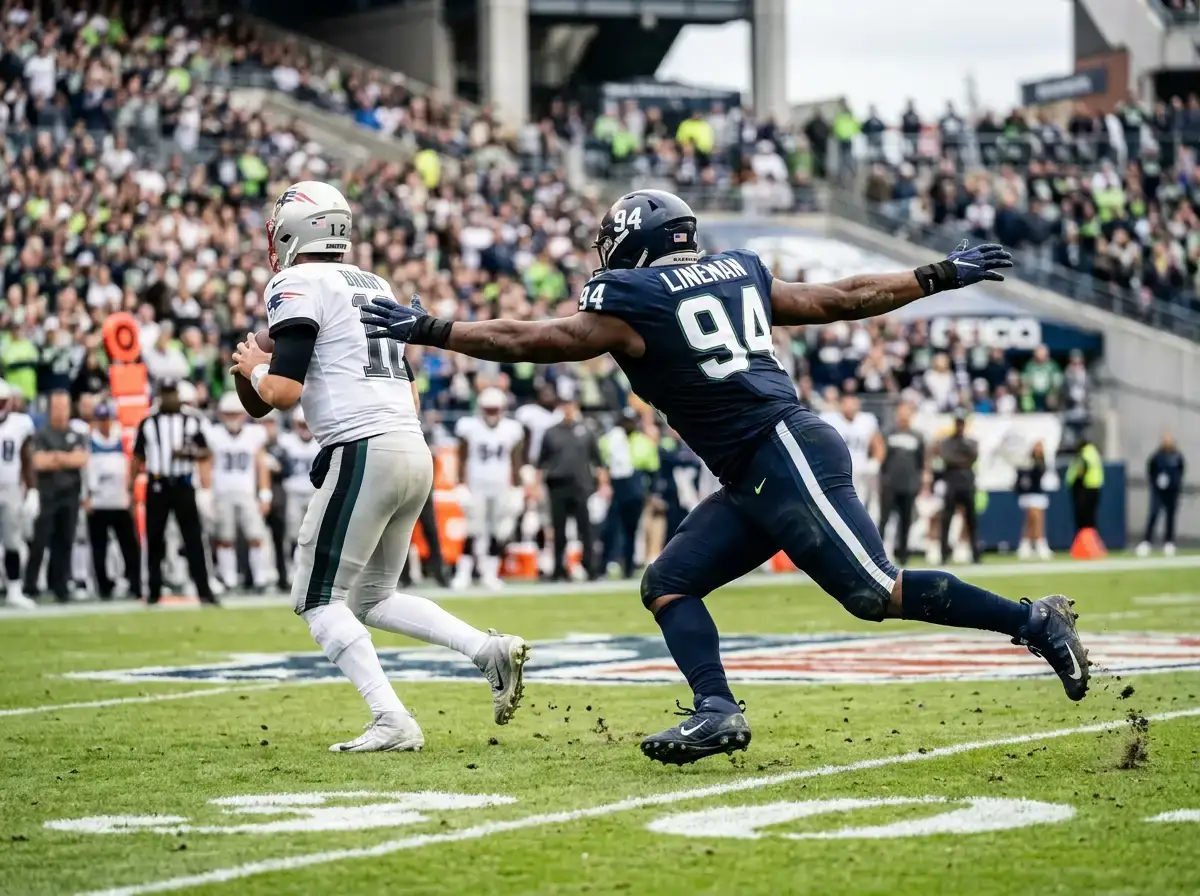
Most punters watch the quarterback throw the ball and the receiver catch it. I spent years doing the same thing before I started watching what happens on the other side of the line of scrimmage. The moment I shifted my focus to defensive schemes – who’s rushing the passer, how the secondary is aligned, whether a team plays zone or man coverage – my prop betting results improved markedly. The defence doesn’t just react to the offence. It dictates what the offence can do, and that dictation is where some of the softest prop lines in the NFL hide.
Defensive prop markets are thinner than their offensive counterparts, which means less sharp money shaping the lines and more room for an informed punter to find genuine value. Here’s how I approach each of the major defensive prop categories and what metrics drive my decisions.
Sack Totals and Interception Betting Odds
A question I get asked constantly: “Are sack props just random?” They feel random – a quarterback might get sacked 5 times one week and 0 times the next. But the underlying data tells a different story.
Sack props are driven by two measurable factors: the pass rush’s pressure rate and the offensive line’s protection rate. A defence that pressures the quarterback on 30%+ of dropbacks is a sack-generating machine, especially when paired with an offence that holds the ball longer in the pocket. Average time to throw is a Next Gen Stat that correlates directly with sack probability. Quarterbacks who release the ball in under 2.5 seconds get sacked at roughly half the rate of those who hold the ball for 3.0+ seconds. When a fast-releasing quarterback faces a high-pressure defence, the sack over is usually overpriced. When a statue in the pocket faces that same defence, the over becomes appealing.
Interception props are harder to predict because interceptions are partly a function of ball placement and decision-making – factors that fluctuate game to game. But there are structural edges. Quarterbacks facing heavy blitz rates tend to throw more interceptions because the pressure forces quicker, less accurate throws. Teams that play aggressive man coverage create more contested catches, which lead to more deflections and picks. If you’re betting a quarterback’s interception prop, check the opposing defence’s blitz rate and their interception rate per coverage snap. Those two numbers together are more predictive than a quarterback’s season-long interception count.
How Coverage Schemes Affect Receiving Props
This is the section that changed how I bet on receiving yards. For years, I backed receivers based on their talent – the best route runners, the fastest vertical threats. Then I started tracking how different defensive schemes redistribute targets, and I realised that the scheme matters as much as the player.
Zone coverage – where defenders protect areas of the field rather than following specific receivers – creates opportunities for different types of pass catchers than man coverage does. In zone schemes, slot receivers and tight ends thrive because they can find soft spots between defenders. Outside receivers face more traffic and contested windows. If you’re betting a slot receiver’s receptions over against a team that plays 65%+ zone coverage, the matchup grades out well. If you’re backing an outside receiver in the same game, think twice.
Man coverage flips the equation. In man schemes, each defender is assigned a specific receiver, which means individual matchups become everything. A top-tier outside receiver against a struggling cornerback in man coverage is one of the most reliable edges in prop betting. The receiver will see a high volume of targets because the offence knows the matchup is favourable, and his yards per route run against man coverage tells you how efficiently he converts those targets into production. Average hold rates have risen from 6-7% in 2021 to 9-11% by 2025 across major operators, which means you need a meaningful analytical edge to overcome the bookmaker’s margin – and defensive scheme analysis provides exactly that.
One pattern I’ve exploited consistently: when a team switches defensive coordinators mid-season or installs a new scheme, the coverage tendencies change before the bookmakers fully reprice the props. A team that played 70% zone under the old coordinator might shift to 55% zone under the new one, and that shift changes which receivers get value and which don’t. Tracking these coaching changes gives you a window of mispriced lines that can last 2-3 weeks.
Run Defence Metrics and Rushing Prop Lines
Rushing props don’t get the same analytical treatment as passing props, partly because running the ball is perceived as simpler. But the defensive side of rushing is rich with data that most punters ignore.
Run defence DVOA – the metric that measures how well a defence stops the run compared to league average, adjusted for opponent – is the starting point. A running back facing a defence that ranks in the bottom 5 in run defence DVOA is in a spot where the rushing yards over deserves serious consideration. But DVOA alone isn’t enough. You need to look at front alignment and personnel. Defences that play with a true nose tackle in a 3-4 scheme stuff the run differently than 4-3 defences with penetrating defensive tackles. The gap between these approaches shows up in how easily running backs hit the second level of the defence.
Stuff rate – the percentage of rushing attempts that are stopped at or behind the line of scrimmage – is another metric that feeds directly into rushing prop analysis. A defence with a high stuff rate makes it harder for backs to accumulate volume yards, even if the occasional big run inflates the per-carry average. For prop betting, consistency matters more than explosiveness. A back who gains 4.2 yards per carry with a low stuff rate against him is a safer over bet than one who averages 5.0 yards per carry but gets stuffed at the line on 25% of his attempts.
The least appreciated factor in rushing props is game script and how it interacts with defensive personnel. When a team takes a lead, it runs the ball more – but the opposing defence also shifts to lighter personnel to facilitate the passing game on their next possession. That lighter defensive personnel is easier to run against, creating a feedback loop where leads beget more rushing yards. Backing rushing overs on teams that are favoured by a touchdown or more is one of the most straightforward edges in the prop market, and it’s grounded entirely in defensive response patterns.
How do defensive matchups affect receiving yard props specifically?
Defensive coverage schemes dictate which receivers get favourable looks. Zone coverage benefits slot receivers and tight ends who find gaps between defenders, while man coverage creates value for elite outside receivers facing overmatched cornerbacks. Checking a defence’s zone-to-man coverage ratio and their yards allowed by receiver position gives you a clearer picture of where receiving yard props are likely to be mispriced.
Which defensive stats are most predictive for sack prop outcomes?
Pressure rate and the opposing quarterback’s average time to throw are the two most predictive metrics. A defence with a 30%+ pressure rate facing a quarterback who holds the ball for 3.0+ seconds creates the highest-probability sack environment. Blitz rate matters too, but pressures generated on standard rushes are more sustainable predictors than blitz-dependent pressure.
Published by the top nfl Prop Bets team.